Taxonomy of notes
When notes are created they often come in different forms from being very structured by note takers, some with semi-structure and others which are back of the envelope notes. Structure for an application to parse the notes is key and to do so we must understand what actually a note can consist of.
What is a taxonomy?
Here gives the official definition of what taxonomy is. It is essentially the art of classification and how different sections are linked and grouped together.
The taxonomy of notes
Notes can be created into a taxonomy, because notes generally consist of different groups - whether this is textual or pictorial. Below is different categories you may find in typical academic/lecture notes:
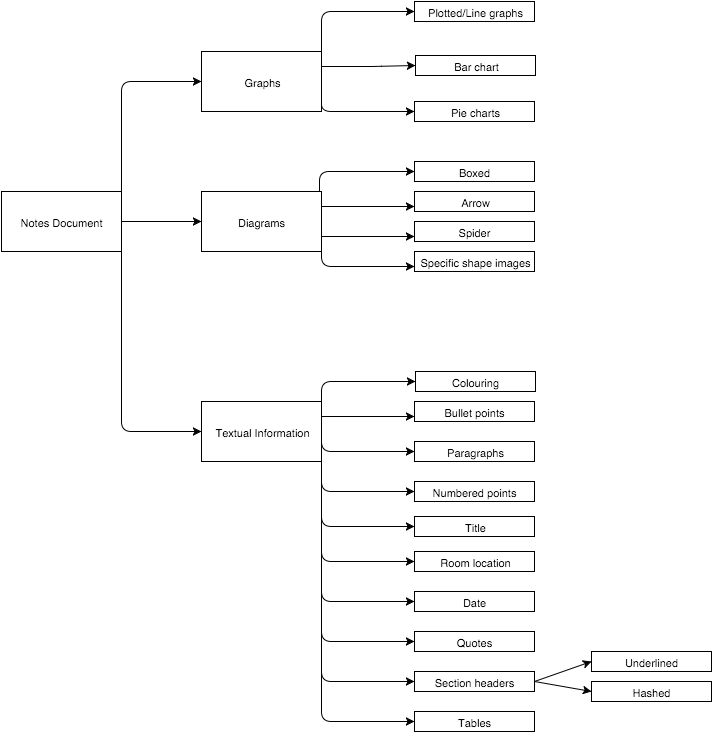
The notes are normally split into three different categories:
- Textual Descriptions
- Diagrams
- Graphs
Textual Descriptions
Textual descriptions on notes form the core content from the user and there are many ways in which text descriptions are formed on notes.
The note may have a series of metadata such as the title, room location and the date. This metadata is important as it gives the notes some context and will form an integral part of archiving, tagging and searching in the application.
Section headers can be represented in a series of ways. A way to represent them is the traditional underline, but this is often difficult to identify on lined paper. Another way, which I may adopt, is how markdown represents headers with the # symbol. The sections help to show a break in the document.
Often notes can consist of pure paragraphs and these are a more detailed sets of notes. Numbered and bullet points are useful to consider parsing because they’re a quick concise way to jot down points. They are often very distinctive with either a number followed by a colon (1:) or a bullet point (●). These are normally integral to many University notes.
Another content of the textual descriptions could be text which is in a different colour, so a note taker may attach headings in red or key words in blue and normal sentences in black.
Finally, another way in which textual descriptions can be represented in notes is via a table such as:
| Test | Example |
|---|---|
| note A | Note B |
This information is easily readable and follows a similar structure by having lines and four corners.
Graphs
Often graphs are a great visual tool to help to show and represent information easily. However, a problem with graphs is that they come in various shapes and sizes. There’s a number of graphs people draw, bar charts, pie charts and scatter and line graphs to name a few. Each has its own shape and size and is not constrained to say five lines.
Diagrams
Diagrams are often drawn on notes. I have separated them out into four different sections: boxed, arrow, spider and specific shape.
The boxed diagrams are ones which are self contained in boxes. Arrow diagrams are where arrows show the flow of the application, so an example is a user drawing a flow chart.
Spider diagrams are often mental brainstorm of ideas, these are probably the hardest to recognise in the application due to the varying shape (either a bubble cloud or circles). The size can vary and you’re often left with a lop-sided spider diagrams.
Finally, specific shapes are diagrams which will vary depending what it is. For example, a person may draw a stick person to represent a user or they may draw a picture of a dog in a biology class. The number of different possibilities for specific shapes are too large to calculate, these would have to have some rules and regulations about the surrounding areas.
Conclusions
Overall, there are many aspects to notes which make the problem of identifying what is on them difficult. The diagram shows the main points with what constitutes a note showing that notes form a sensible structure which can then be catergorised.